EDA in Intersect Mode
The Exploratory Data Analysis (EDA) in Intersect mode enables you to access summary statistics about the intersection of a group of datasets without needing access to the data itself. It is used primarily with VFL use cases to understand statistics about the overlapped records. For example, you may be interested in “what is the distribution of age among the intersection” (the intersection mode), which could be a very different answer from “what is the distribution of age among the whole population” (the individual mode).
With EDA Intersect, you can:
obtain descriptive statistics, as in EDA Individual mode, but on the intersection (i.e., overlapping indices)
use bivariate operations such as
groupbyorcorrelationcompute the correlation matrix
plot a 2D histogram based on the joint distribution of two features from different clients
EDA is an important pre-step for federated modelling and a simple form of federated analytics. This feature has a built-in mechanism to achieve differential privacy. Proper noise is dynamically added to each histogram that is generated for each feature in a participating dataset. This adds extra protection on the raw data by making the final results differentially private, but at the same time it means the final results will deviate slightly from the true values.
API Reference
The core API module that contains the EDA-specific functionality is integrate_ai_sdk.api.eda. This module includes a core object called EdaResults, which contains the results of an EDA session. If you are comfortable working with the integrate.ai SDK and API, see the API Documentation for details.
Configure an EDA Intersect Session
EDA intersect mode allows you to explore the distribution of the overlapping data.
Steps to run a EDA Intersect session
Specify dataset configuration: specify an
eda_data_configdictionary indicating the client names and columns to be explored in the EDA Intersect session. Note that the client names in theeda_data_configmust be aligned with the previously completed PRL session.Create an EDA Intersect session: configure an EDA session with the specified data configuration. Specify the session parameter
eda_mode="intersect"to enable the intersect mode, and specify the previously completedprl_session_idas session parameter. The EDA session_id can be used to track the session status in the UI, and it can also be used to load a completed EDA session.Create a task group: to manage the session process.
#Example data columns
consumer_features = ['id', 'loss_amount', 'loss_amount_log', 'num_floor_norm',
       'building_age_norm', 'flood_zone', 'region_code_AB', 'region_code_BC',
       'region_code_NS', 'region_code_ON', 'region_code_QC', 'industry_code_A',
       'industry_code_B', 'industry_code_C', 'building_type_X',
       'building_type_Y', 'building_type_Z', 'region_code', 'industry_code',
       'building_type', 'num_floor', 'building_age']

consumer_features_sub = ['num_floor_norm', 'building_age_norm', 'flood_zone']

acme_features = ['crime_norm', 'fire_norm', 'crime', 'fire']
The eda_data_config specifies the names of the datasets used to generate the intersection in the PRL session in the format dataset_name : columns. If columns is empty ([]), then EDA is performed on all columns.
#EDA config

eda_data_config = {consumer_train_name: consumer_features_sub}

#Paired columns for EDA Intersect

eda_pair_data_config = {consumer_train_name: consumer_features,
                   acme_data: acme_features}
Note
Any columns that were used as identifiers during the PRL sessions are automatically excluded.
About Paired Columns
To find the correlation (or any other binary operation) between two specific columns between two datasets, you must specify those columns as paired columns.
To set which pairs you are interested in, specify their names in a dictionary like eda_data_config.
single_client_2d_pairs = {"active_client": ['x0', 'x2'], "passive_client": ['x1']}

cross_client_2d_pairs = {"active_client": ['x0', 'x2'], "passive_client": ['x1']}
For example: {"passive_client": ['x1', 'x5'], "active_client": ['x0', 'x2']}
will generate 2D histograms for these pairs of columns:
(x0, x1), (x0, x5), (x2, x1), (x2, x5), (x0, x2), (x1, x5)
Create an EDA intersect session
The code sample demonstrates creating and starting an EDA session to perform privacy-preserving data analysis on the intersection of two distinct datasets. It returns an EDA session ID that you can use to track and reference your session.
eda_session = client.create_eda_session(
    name="EDA Intersect Session",
    description="Testing EDA Intersect mode through a notebook",
    data_config=eda_data_config,
    eda_mode="intersect",                           #Generates histograms on an overlap of two distinct datasets
    prl_session_id=prl_session_id,                  #Required for intersect mode
    single_client_2d_pairs = None,                  #Optional - only required to generate single node 2D histograms (both columns in same dataset)
    cross_client_2d_pairs = eda_pair_data_config       #Optional - only required to generate 2D histograms (between two datasets)
).start()

eda_session.id
Session parameters:
eda_mode= One of {‘individual’,’intersect’}. Defaults to ‘individual’.prl_session_id(str): Session ID of associated PRL session. Required for eda_mode = ‘intersect’.single_client_2d_pairs(Dict, optional): a data_config like dict with the column names to use to generate 2d-histograms when both columns belong to same dataset. This option only considers the single node 2d-histograms and is valid for both ‘intersect’ and ‘individual’ mode. Defaults to None which means that no local 2d-histogram is generated.cross_client_2d_pairs(Dict, optional): a data_config like dict with the column names to use to generate cross-dataset 2d-histograms. This option only works for ‘intersect’ mode. Defaults to None which means that no cross-client 2d-histogram is generated.
Note that, unlike other sessions, you do not need to specify a model_config file for EDA. This is because there are no editable parameters.
For more information, see the create_eda_session() definition in the API documentation.
Create and run the task group
Create a task in the task group for each client. The number of tasks in the task group must match the number of clients specified in the data_config used to create the session.
Tip
The dataset_name specified in the task must be identical to the client_name specified in the PRL session.
eda_task_group = (
    SessionTaskGroup(eda_session)
    .add_task(iai_tb_aws_consumer.eda(dataset_name=consumer_train_name))\
    .add_task(iai_tb_aws_provider.eda(dataset_name=acme_data))\
)

eda_task_group_context = eda_task_group.start()
Monitor submitted EDA Intersect jobs
Submitted tasks are in the Pending state until the clients join and the session is started. Once started, the status changes to Running.
for i in eda_task_group_context.contexts.values():
    print(json.dumps(i.status(), indent=4))

eda_task_group_context.monitor_task_logs()

# Wait for the tasks to complete (success = True)

eda_task_group_context.wait(60*5, 2)
When the session completes successfully, “True” is returned. Otherwise, an error message appears.
Analyze the results
To retrieve the results of the session:
results = eda_session.results()
Example output:
EDA Session collection of datasets: ['active_client', 'passive_client']
Review Summary Statistics
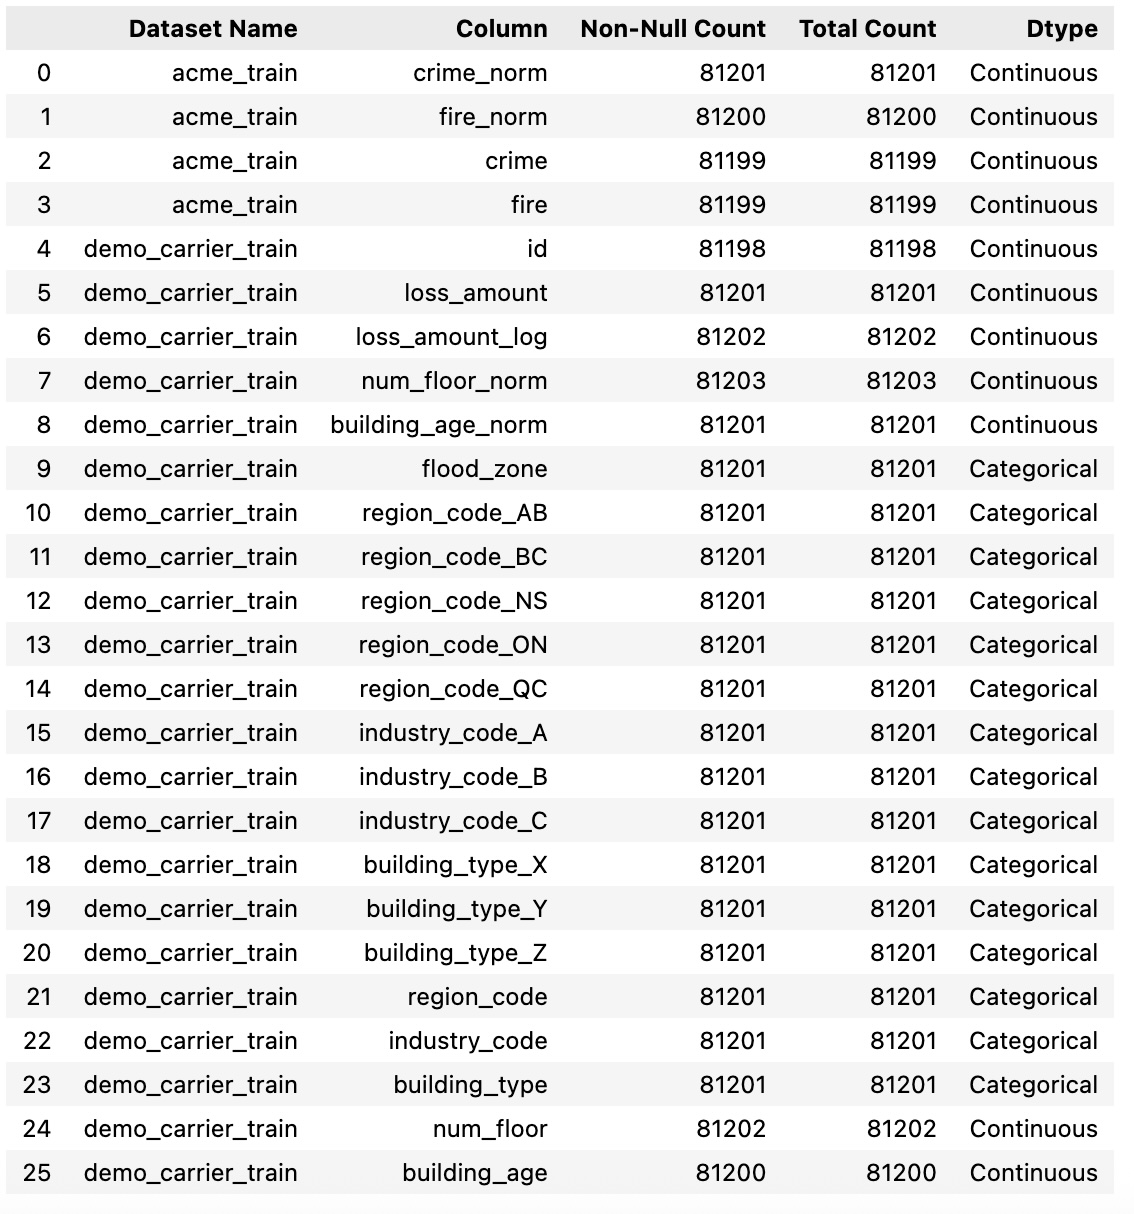
Use the eda_res.info() function to retrieve the non-NaN count and the feature type (categorical or continuous). This function calculate the stats you would get in the describe() function of a dataframe in pandas (pandas.DataFrame.describe).
eda_res = eda_session.results()
df_info = eda_res.info()
df_info
Example output:
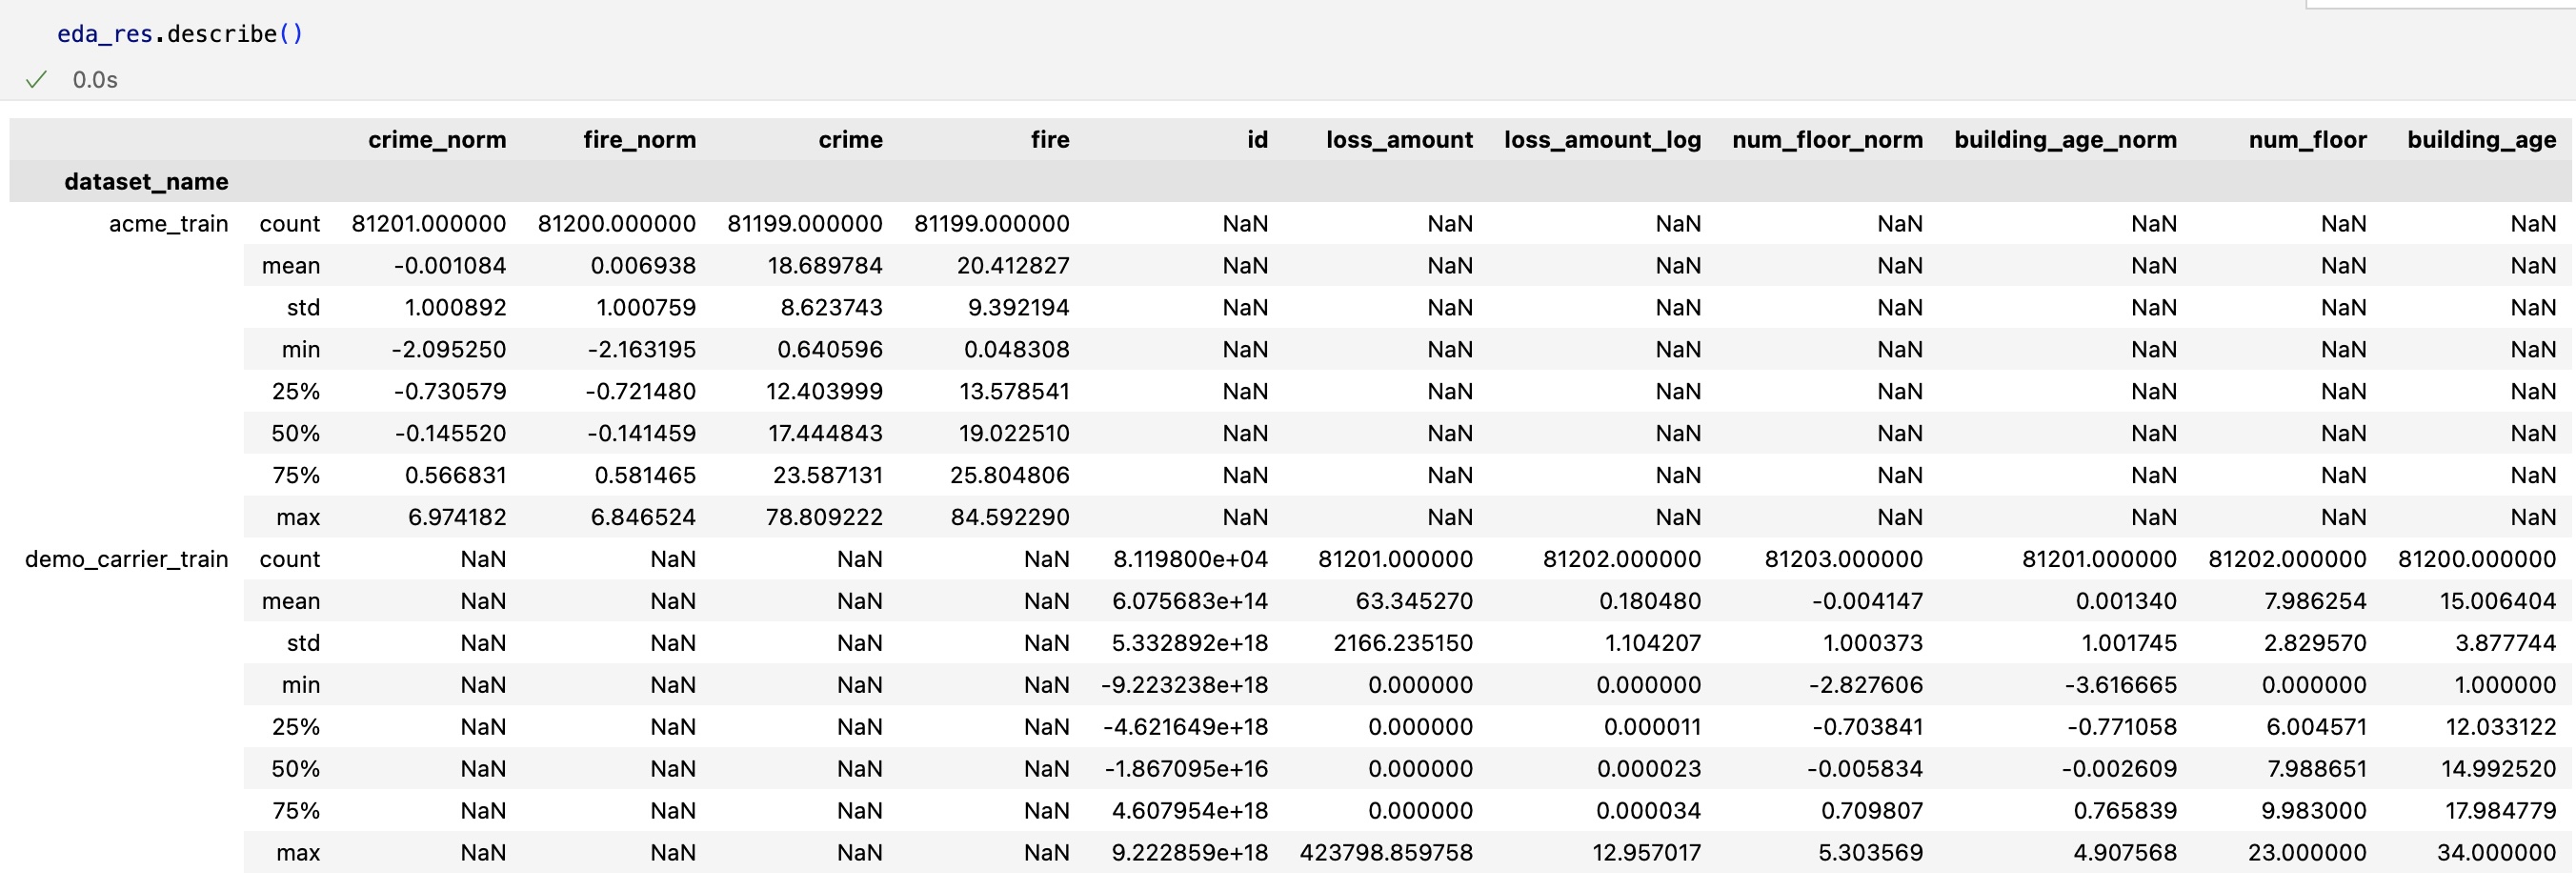
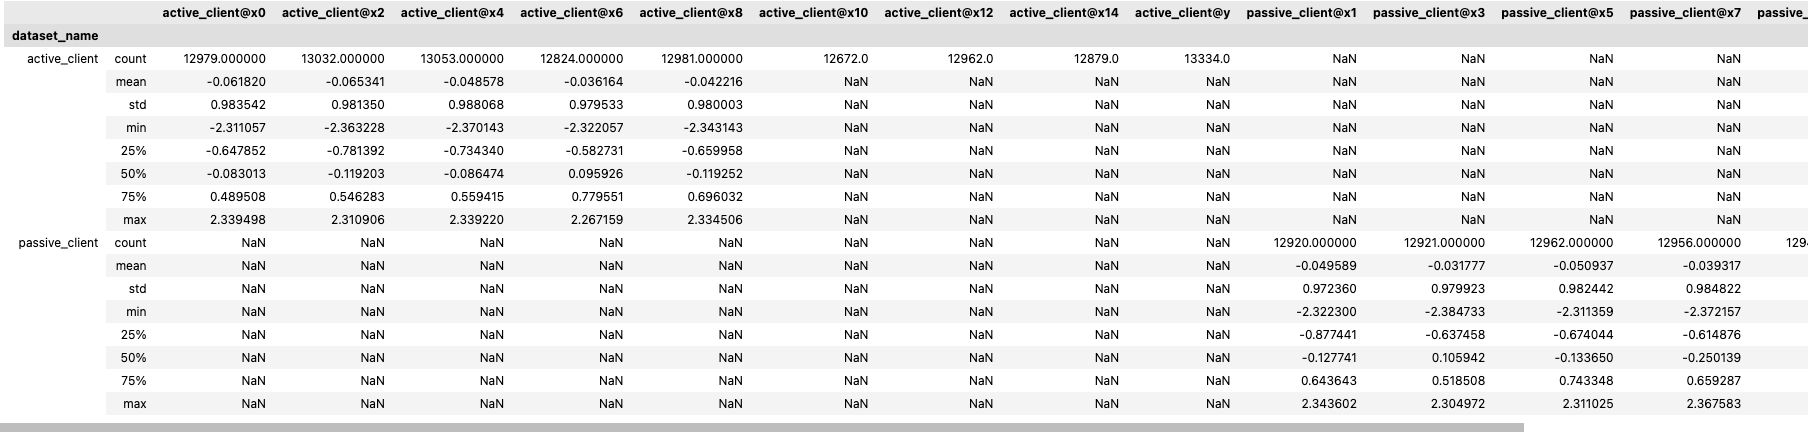
Use the eda_res.describe() function to show the summary statistics for continuous features. For categorical features, the number of levels and mode are returned instead of summary statistics.
Example output:
Categorical example:
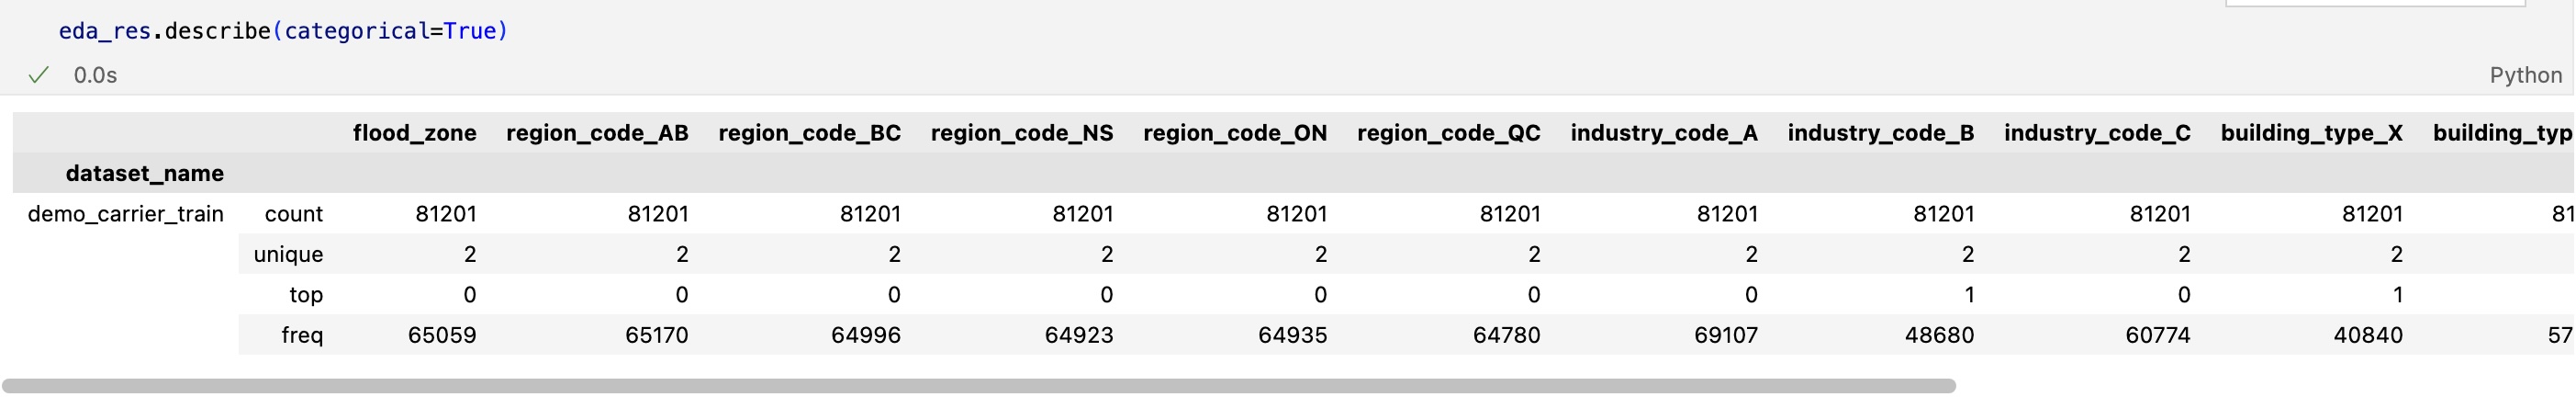
Example output:
Histograms
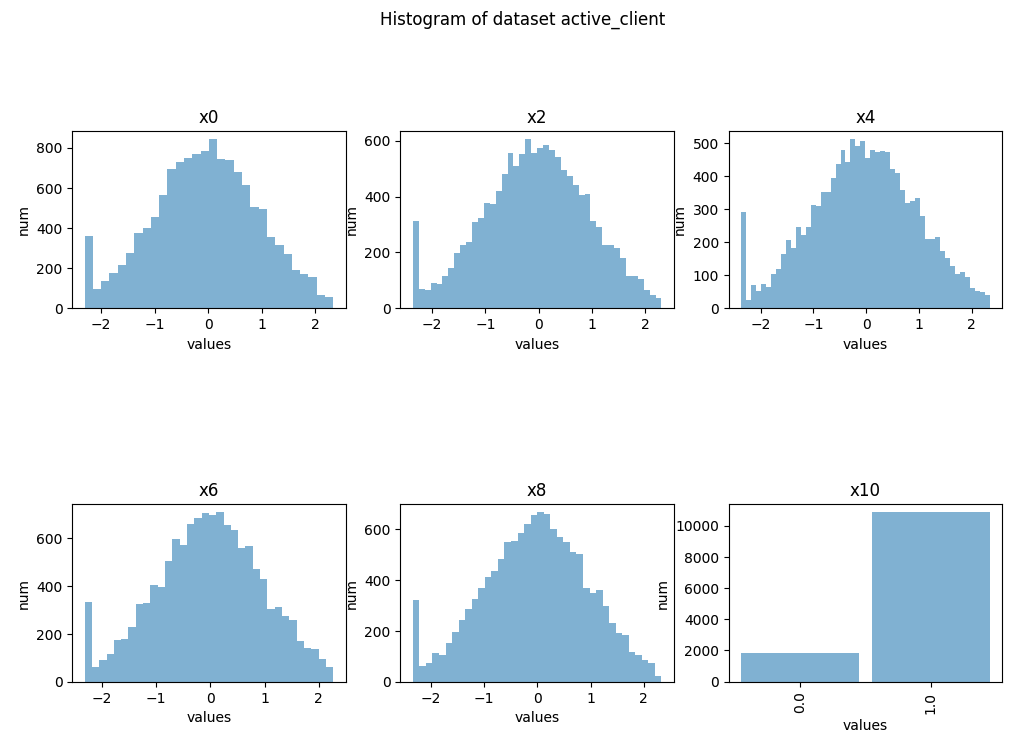
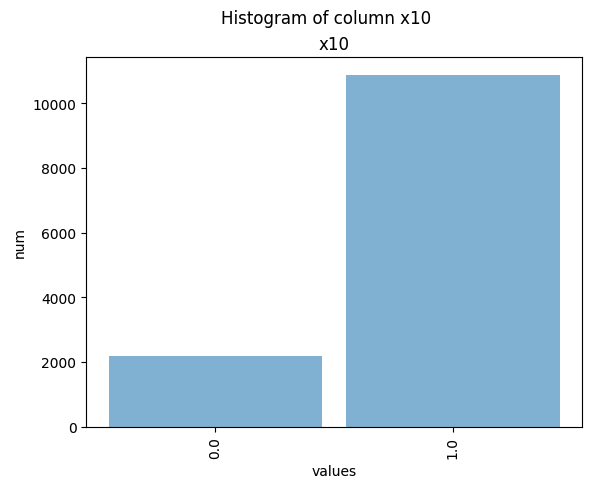
You can create histogram plots using the .plot_hist() function.
saved_dataset_one_hist_plots = results["active_client"].plot_hist()
Example output:
single_hist = results["active_client"]["x10"].plot_hist()
Example output:
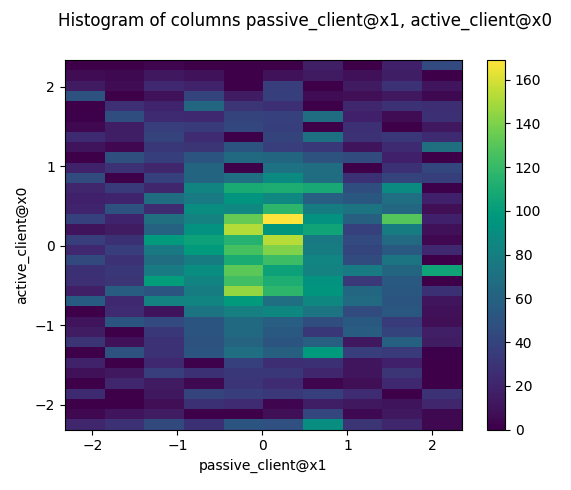
2D Histograms
You can also plot 2D-histograms of specified paired columns.
fig = results.plot_hist(active_client['x0'], passive_client['x1'])
Example output:
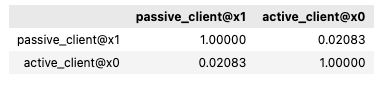
Correlation
You can perform binary calculations on columns specified in paired_columns, such as finding the correlation.
results.corr(active_client['x0'], passive_client['x1'])
Example output:
GroupBy
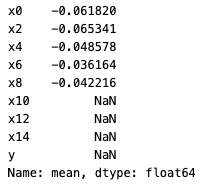
groupby_result = results.groupby(active_client['x0'])[passive_client['x5']].mean()
print (groupby_result)
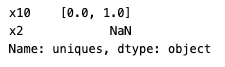
Other Statistics
For categorical columns, you can use other statistics for further exploration. For example, unique_count, mode, and uniques.
results["active_client"][["x10", "x11"]].uniques()
Example output:
Mean
You can call functions such as .mean(), .median(), and .std() individually.
results["active_client"].mean()
Example output: