Dataset Contribution Analysis
integrate.ai provides features to address dataset contribution at two different levels:
Dataset Influence Score that quantifies and ranks the influence each dataset has on a model.
Feature Importance Score that quantifies and ranks features across contributing datasets, based on their influence on a global model.
We use the Shapley values from game theory and their related extensions to determine the scores.
Where they can be applied
The calculation of these scores is built into our federated modeling sessions. Influence results are calculated during every round of the federated training session and are displayed with the results of the session to show how these scores trend over the training rounds. Feature importance is only evaluated once, at the end of the training.
The Data Influence Score and Feature Importance Score are applicable to regression/classification tasks for federated learning. This applies to the following model types:
Feed forward neural nets (SplitNN)
Generalized linear models (GLM)
Examples of calculating and plotting the scores for both dataset influence and feature importance for a SplitNN VFL session are available in the VFL SplitNN Model Training. The example plots shown in this section are generated according to those examples.
Note: A completed successful PRL session (prl_session_id) with the appropriate overlap is required input for the VFL session. For more information about PRL sessions, see Private Record Linkage (PRL) sessions. For an overview of VFL SplitNN, see VFL SplitNN Model Training.
Dataset Influence
Dataset influence measures the impact of an individual dataset (that is, a data product) on the performance of a machine learning model trained using the integrate.ai platform. By running dataset influence, a Data Consumer can understand to what extent a Data Provider’s data product contributed to the performance of a machine learning model they trained. This feature can be used in conjunction with other evaluation jobs to help Data Consumers answer the question of data product relevance to their project.
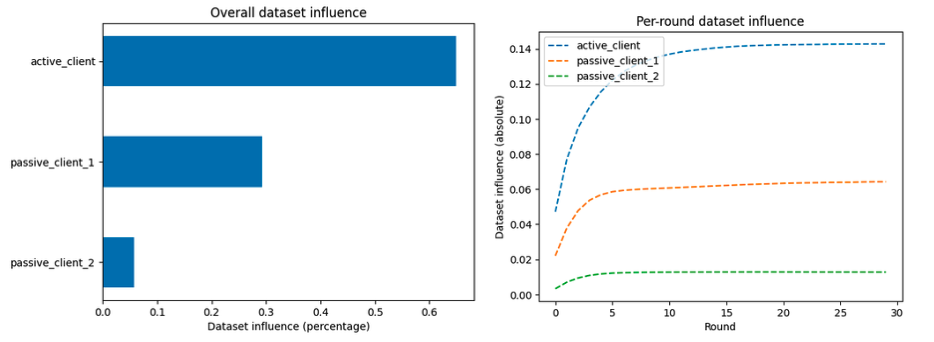
This score is based on multi-round Shapley values. It can be shown as a percentage of overall influence of clients on the final model (shown in bar plot below) or as an absolute score (shown in line graph below). The absolute score can be plotted on a per round basis, to see how the influence stabilizes as training progresses.
Calculating Influence Scores
# Dataset influence scores are enabled by default.
    "influence_score": {
        "enable": True,
        "params": {
            "rel_thresh": 0.01,
            "max_eval_len": None
        }
    },
This feature is enabled by default.
To view influence scores, add the sample code shown to your VFL model_config.
Parameters:
rel_threshis the relative threshold of performance metric for determining whether to stop evaluation early. The influence score is calculated by breaking down the total model improvement over a round and assigning them to different datasets. If the total model improvement is very small, then it is not necessary to calculate the influence. In this case you can stop evaluation early to speed up training. For example, the default0.01means when the model performance metric changes less than 1% in one particular round, stop influence evaluation.max_eval_lenis the maximum length of sub-combinations to consider. It determines whether to apply an approximation of the full Shapley score calculation. It takes values from 0, 1, …, num_datasets. The smaller the value, the faster the calculation, while at the same time the less reliable the scores are. Default isNonein which case, no approximation is performed.
Plotting Influence Scores
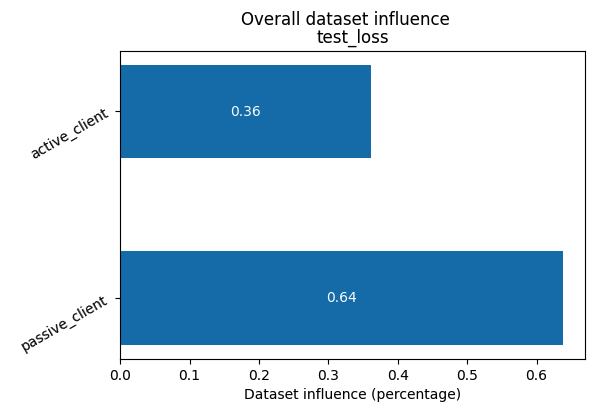
Add the following sample code to plot overall influence of clients on the final model.
vfl_train_influence_scores = vfl_train_session.influence_scores(all_metrics=False)
_ = vfl_train_influence_scores.plot()
This produces a bar plot.
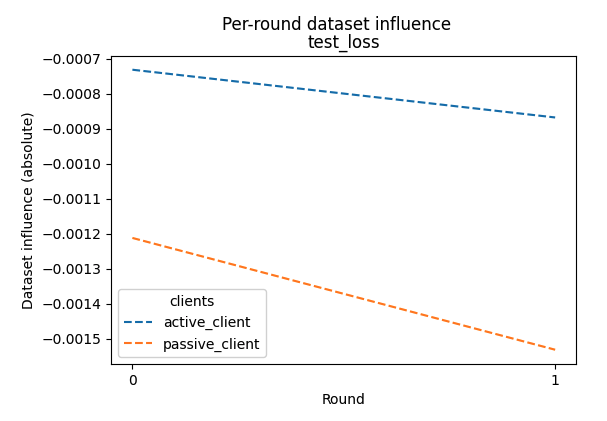
Add the following sample code to plot the per round influence of clients on the final model.
_ = vfl_train_influence_scores.plot(per_round=True)
This produces a line graph.
Feature Importance
Data Consumers can use feature importance to understand how specific features in a Data Provider’s data product impacted the performance of a machine learning model they trained. They can also compare features to the features in their own data. Note that if the data product consists of only one feature, we recommend using Dataset Influence instead of Feature Importance. Feature importance can be used in conjunction with other evaluation jobs to help Data Consumers answer the question of data product relevance to their project.
This score is based on the “SHapley Additive exPlanations” (SHAP) method and is single-round.
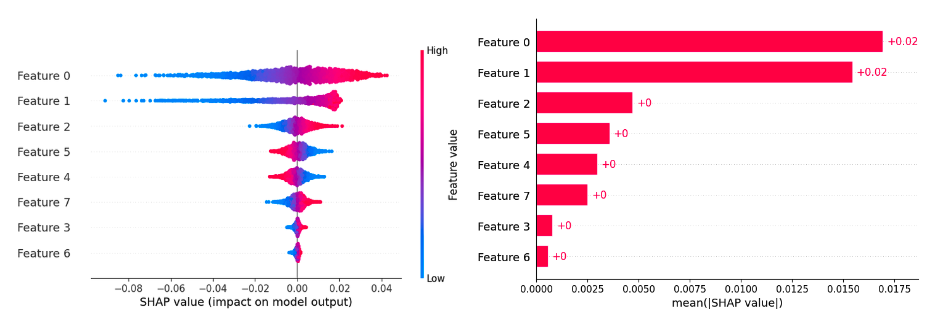
Use the SDK to plot this score as a beeswarm or a bar plot. The beeswarm plot represents the individual SHAP value for each data point in the feature. The bar plot shows the overall importance of a feature - the bigger the magnitude (absolute value), the more important the feature. The overall importance of a feature is the average of absolute SHAP value of the samples.
This feature is disabled by default.
Calculating Feature Importance Scores
# Feature importance scores are disabled by default. To enable, set "enable" to True.
    "feature_importance_score": {
        "enable": True,
        "params": {
            "max_evals": None,
            "subsample": None,
            "random_seed": 23,
        }
    },
To enable feature importance, add the sample code shown to your VFL model_config.
At a high level, feature importance is a type of sensitivity analysis. For one given real sample, we generate a set of “fake samples” by perturbing a subset of feature values, then check how the model output changes accordingly. The parameters determine the setting for this sensitivity analysis.
Parameters:
max_evalsmeans the number of “fake samples” to generate for each real sample. The default is10 * (2 * total_n_features + 1), which grows with number of features. You can cap it by setting a fixed integer (e.g., 500), but in that case when the number of features increases, the reliability of the importance score will decrease as you get less fake samples per features.subsamplecontrols how many real samples to consider from the test dataset. By default it considers all the samples. You can set a fraction to represent the percentage to select, or an integer to represent the actual number of samples to select.random_seedcontrols the randomness of generating fake samples. This is separate from therandom_seedset for the overall model training in themodel_config.
Plotting Feature Importance Scores
To display the calculated feature importance scores, add the following sample code.
vfl_feature_importance = vfl_train_session.feature_importance_scores()
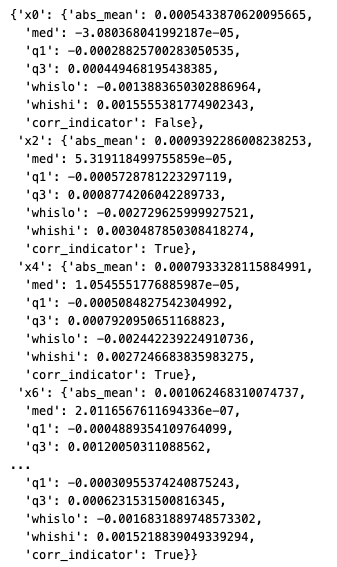
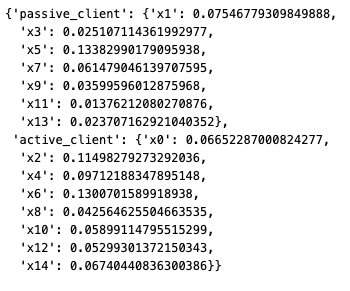
vfl_feature_importance.as_dict()["feature_importance_scores"]
Example output:
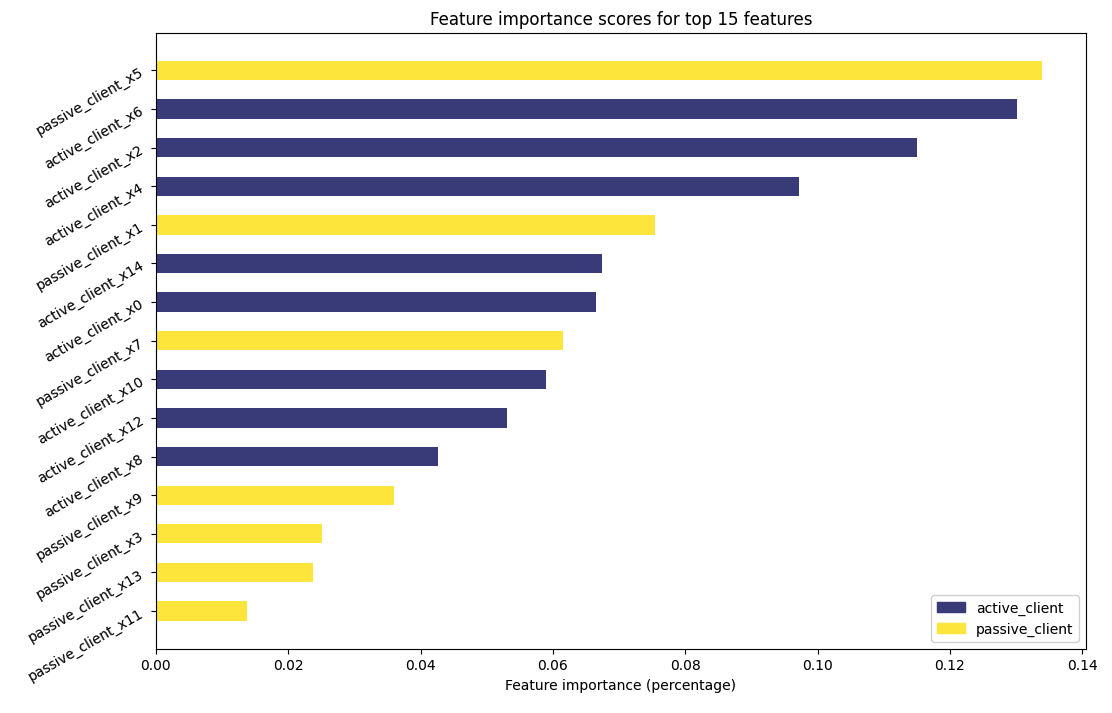
To plot the importance scores for the top 15 features, add the following sample code.
_ = vfl_feature_importance.plot(topk=15)
This produces a bar plot.
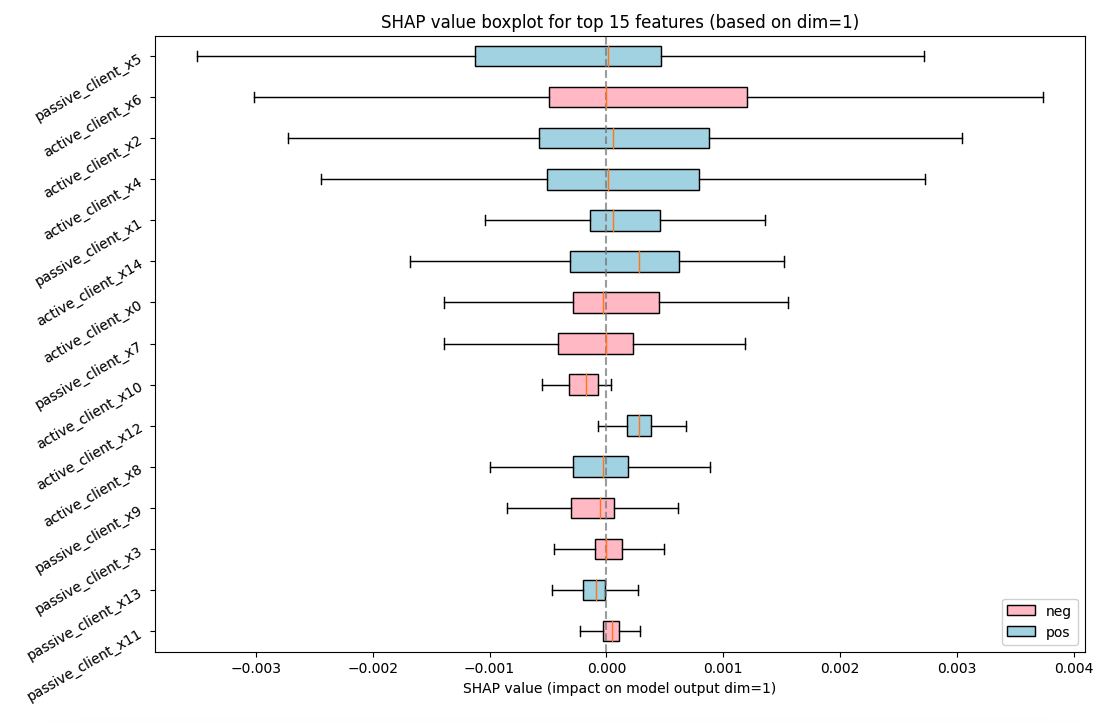
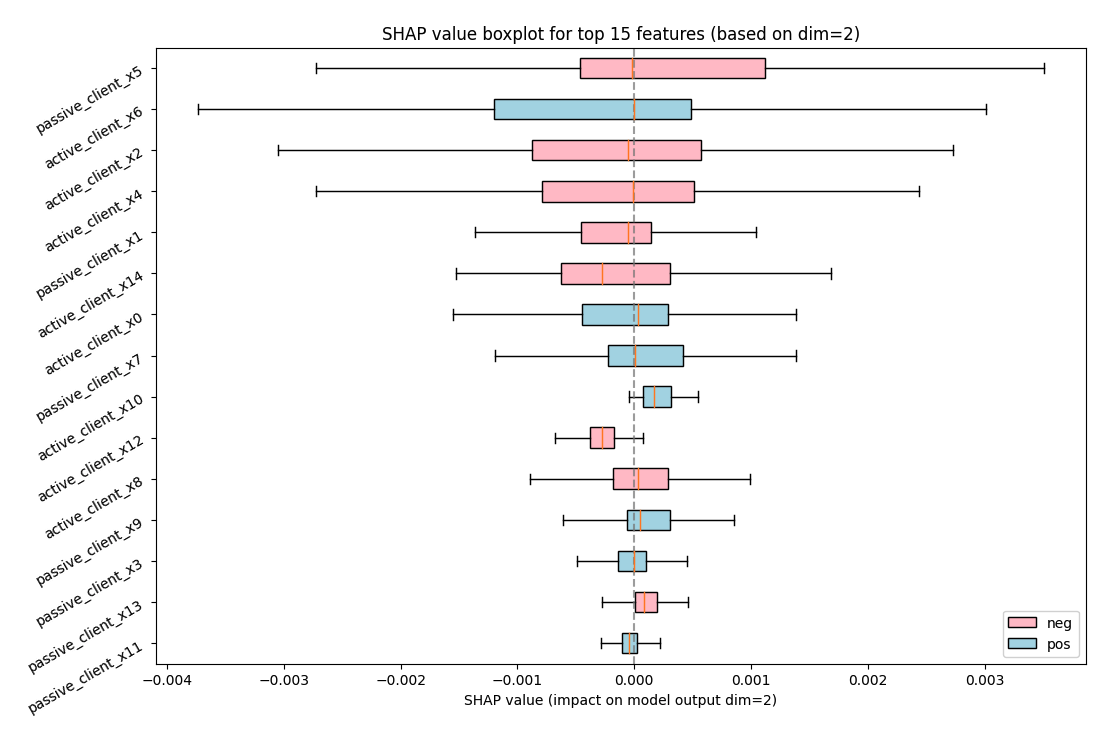
To generate the SHAP value box plots, add the following sample code.
_ = vfl_feature_importance.plot(style="box", topk=15)
This produces two box plots.
To list the feature importance score details, add the following sample code.
vfl_feature_importance.as_dict()["feature_importance_details"][0]["active_client"]
Example output: